
Full Service Coverage
Consulting, dashboard development, data modeling, DAX, Power Query, data integration, ERP integration, implementation, migration, embedded analytics, performance optimization, security, governance, training and ongoing support.
End-to-end Power BI consulting, development and integration — built around your data, KPIs and users.
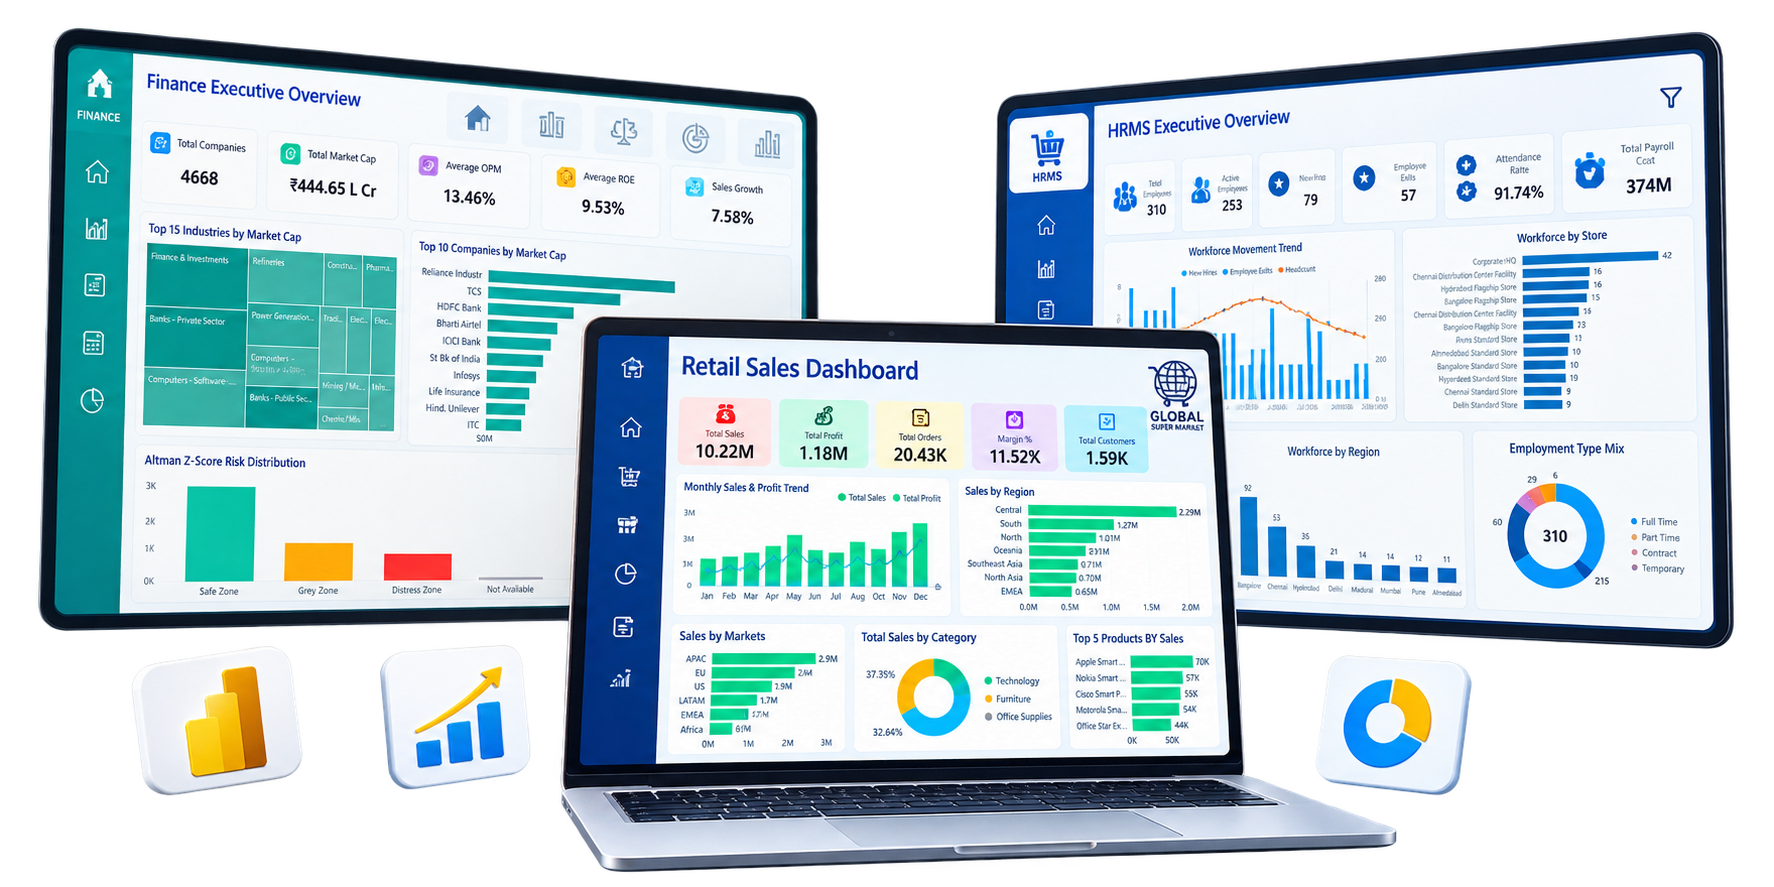
Reno Informatics provides end-to-end Power BI services that help businesses connect data, build reliable reporting environments, understand performance and make better decisions.
Whether you are implementing Power BI for the first time, improving an existing Power BI environment, replacing manual Excel reporting, or connecting Power BI to your ERP and business systems, we build the solution around your data, KPIs, workflows and users.
Consulting, dashboard development, data modeling, DAX, Power Query, data integration, ERP integration, implementation, migration, embedded analytics, performance optimization, security, governance, training and ongoing support.
Works with Reno ERP, other ERP platforms, SQL databases, Excel, CSV files, CRM systems, POS platforms, APIs, cloud applications and other business data sources.
Move from disconnected reports and manual spreadsheets to a structured Power BI environment designed around the way your business operates.
Book a demo, talk to a Power BI expert, or explore the interactive demo to see how reporting can work for your teams.
Microsoft Power BI is a business intelligence and data analytics platform that helps organizations connect information from different sources, transform and model that data, and present it through interactive reports and dashboards.
Instead of relying on separate spreadsheets, manually prepared reports and disconnected systems, Power BI provides a common environment for analyzing business information.
A visually attractive dashboard is only useful when the information behind it is structured correctly. Reno Informatics focuses on the underlying data model as well as the report design so that calculations, filters and relationships work consistently across dashboards.
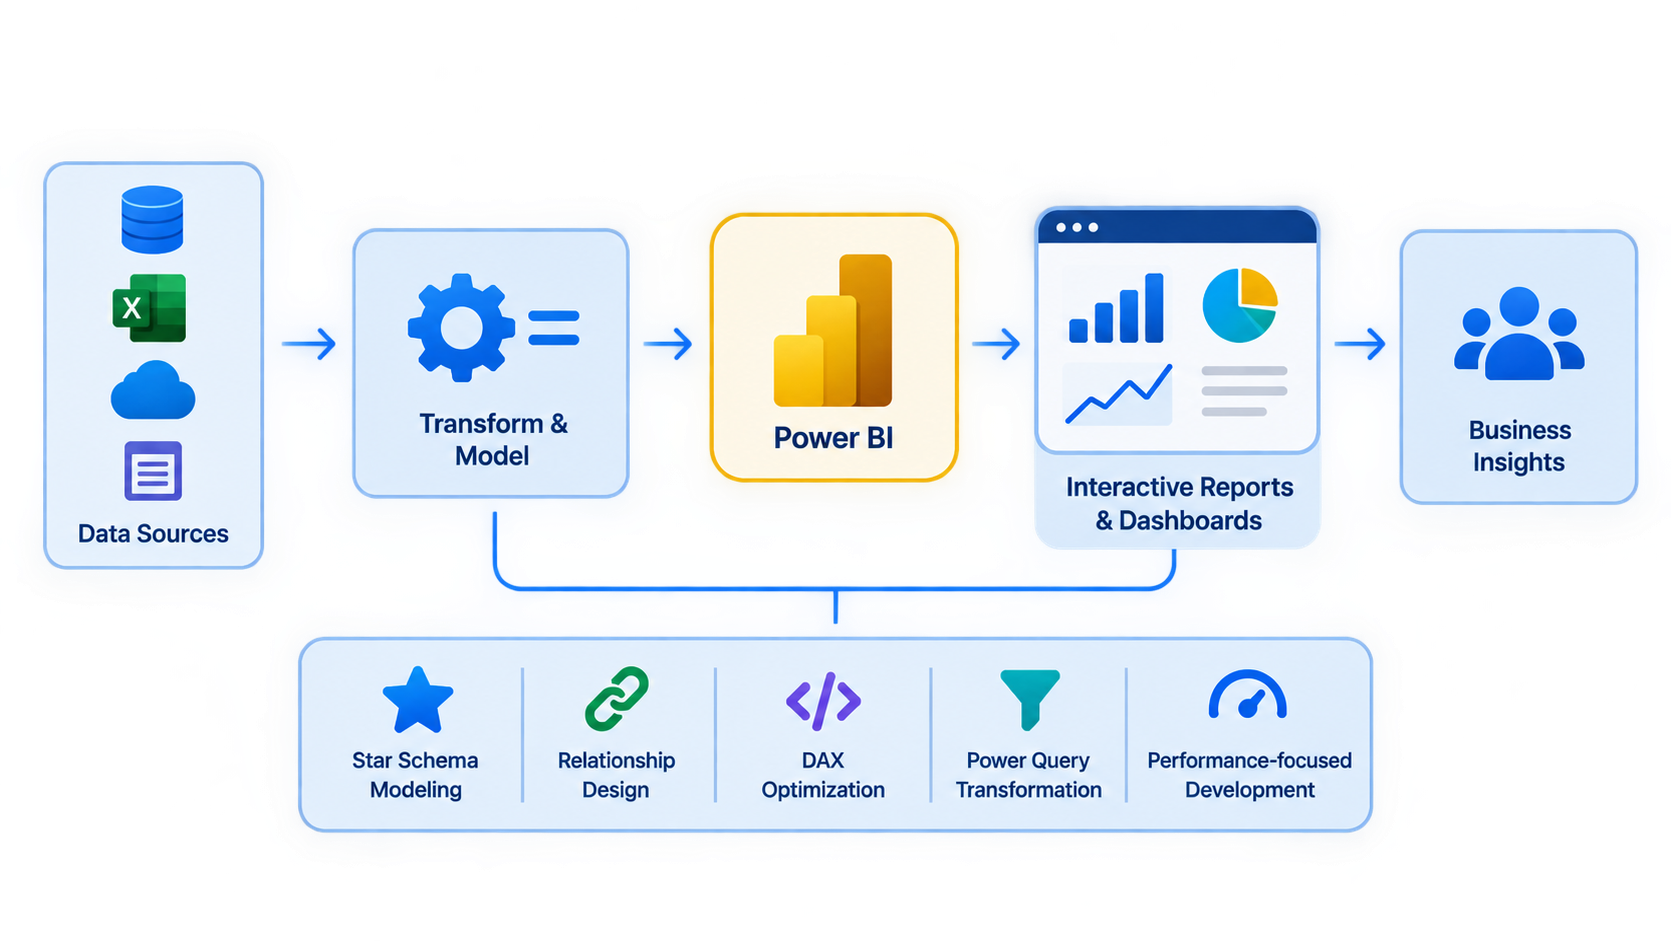
A structured, cyclical workflow connecting enterprise data sources to executive insights and cloud governance.
Power BI connects to ERP systems, SQL databases, Excel, CSV files, CRM platforms, APIs, POS and cloud applications.
Power Query is used to clean, combine, reshape, filter and standardize data before reporting.
Data is organized into star-schema relationships, dimensions, facts and semantic business models.
DAX formulas create KPIs, margins, ratios, growth trends, YoY comparisons and business intelligence.
Modeled data is presented through interactive dashboards, KPI scorecards, drill-downs and charts.
Reports are deployed to Power BI Service with role security (RLS), workspaces and automated refresh.
Power BI connects to ERP systems, SQL databases, Excel, CSV files, CRM platforms, APIs, POS and cloud applications.
Power Query is used to clean, combine, reshape, filter and standardize data before reporting.
Data is organized into star-schema relationships, dimensions, facts and semantic business models.
DAX formulas create KPIs, margins, ratios, growth trends, YoY comparisons and business intelligence.
Modeled data is presented through interactive dashboards, KPI scorecards, drill-downs and charts.
Reports are deployed to Power BI Service with role security (RLS), workspaces and automated refresh.
Try it live — explore an interactive Power BI dashboard and see how business information can be presented through connected reports and visual analytics.
Demo Data Notice: This demonstration uses sample/demo data and is intended to showcase Power BI dashboard design, navigation, filtering and analytical capabilities. It does not represent live customer data.
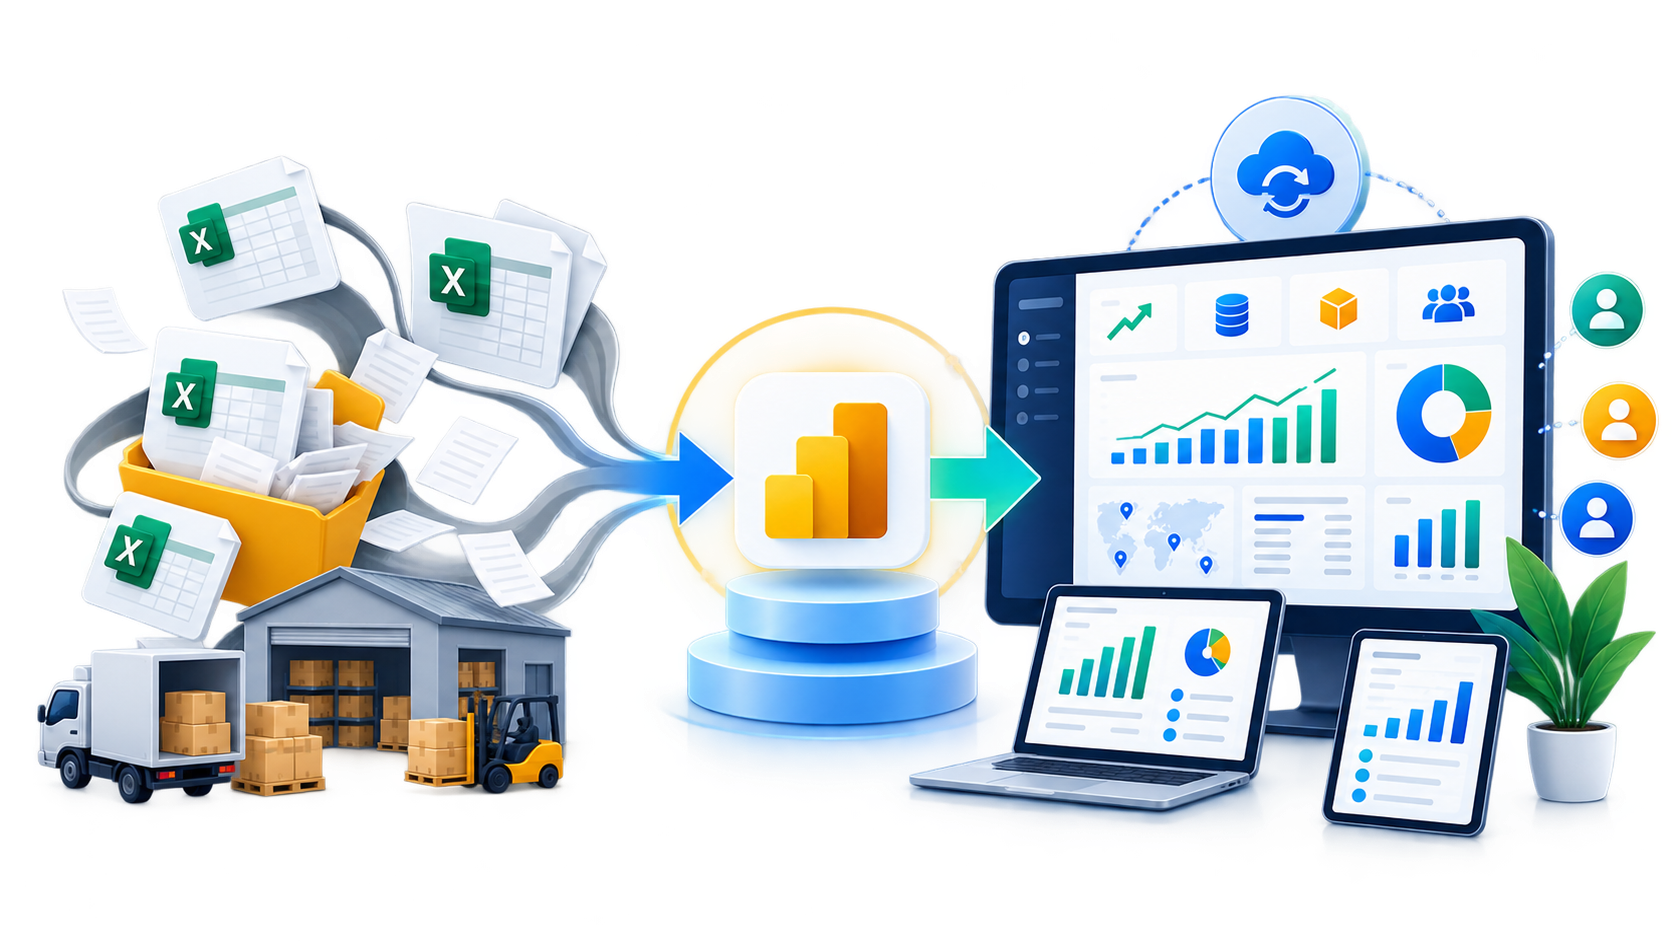
Many businesses still depend on reports that require information to be exported from different systems, combined in spreadsheets and manually prepared before management can review them.
Manual Process Pain Points
Power BI can bring information from different systems into a common analytical environment. Sales data can be analyzed alongside inventory. Finance can be viewed alongside revenue. Customer information can be connected with transactions. Operational data can be combined with management KPIs.
Power BI allows users to filter, drill down, compare periods, examine categories and investigate individual areas of performance without rebuilding the report for every question.
A properly designed semantic model and DAX measures provide a consistent foundation for business calculations. Instead of different departments maintaining their own versions of the same metric, Power BI can provide standardized definitions for important KPIs.
Depending on the data architecture and Power BI environment, reports can be configured for appropriate refresh schedules and data-update processes. This reduces the need to repeatedly prepare the same report manually.
Power BI environments can be designed so users receive access appropriate to their roles, departments, branches or responsibilities — including role-based access, row-level security, column-level security, single sign-on and workspace governance where applicable.
Reno Informatics provides Power BI services across the full reporting lifecycle — from planning and data integration to dashboard development, deployment, optimization and ongoing support.
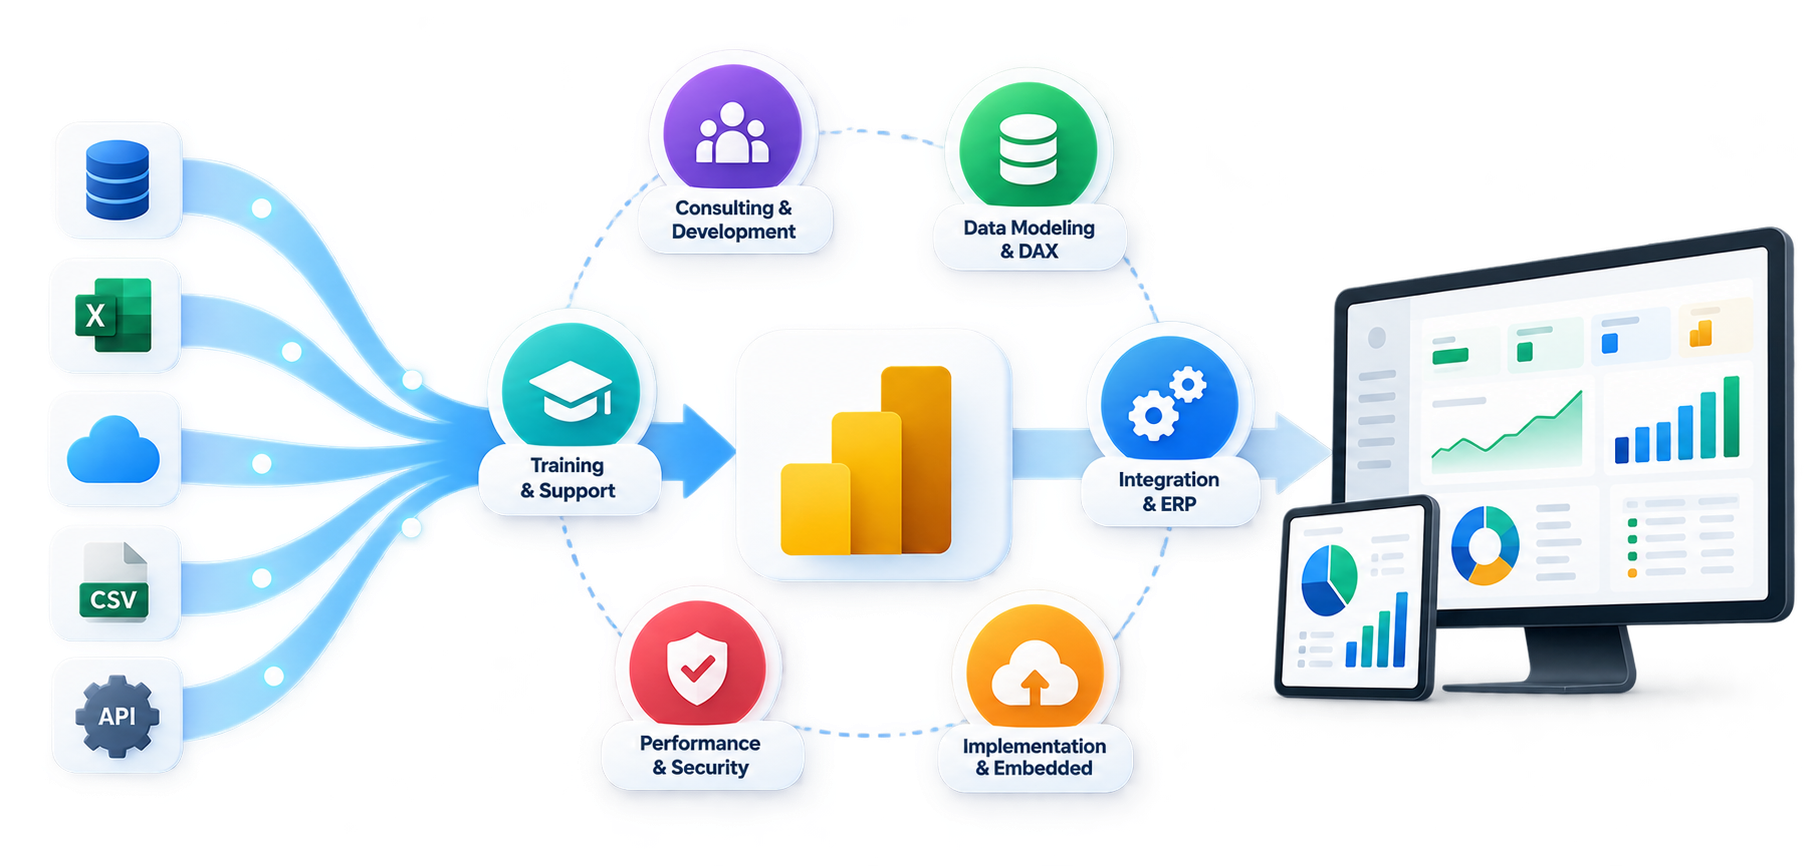
Power BI does not need to be limited to a single business system. Reno Informatics can help bring information from multiple sources into a reporting environment designed around your business requirements.
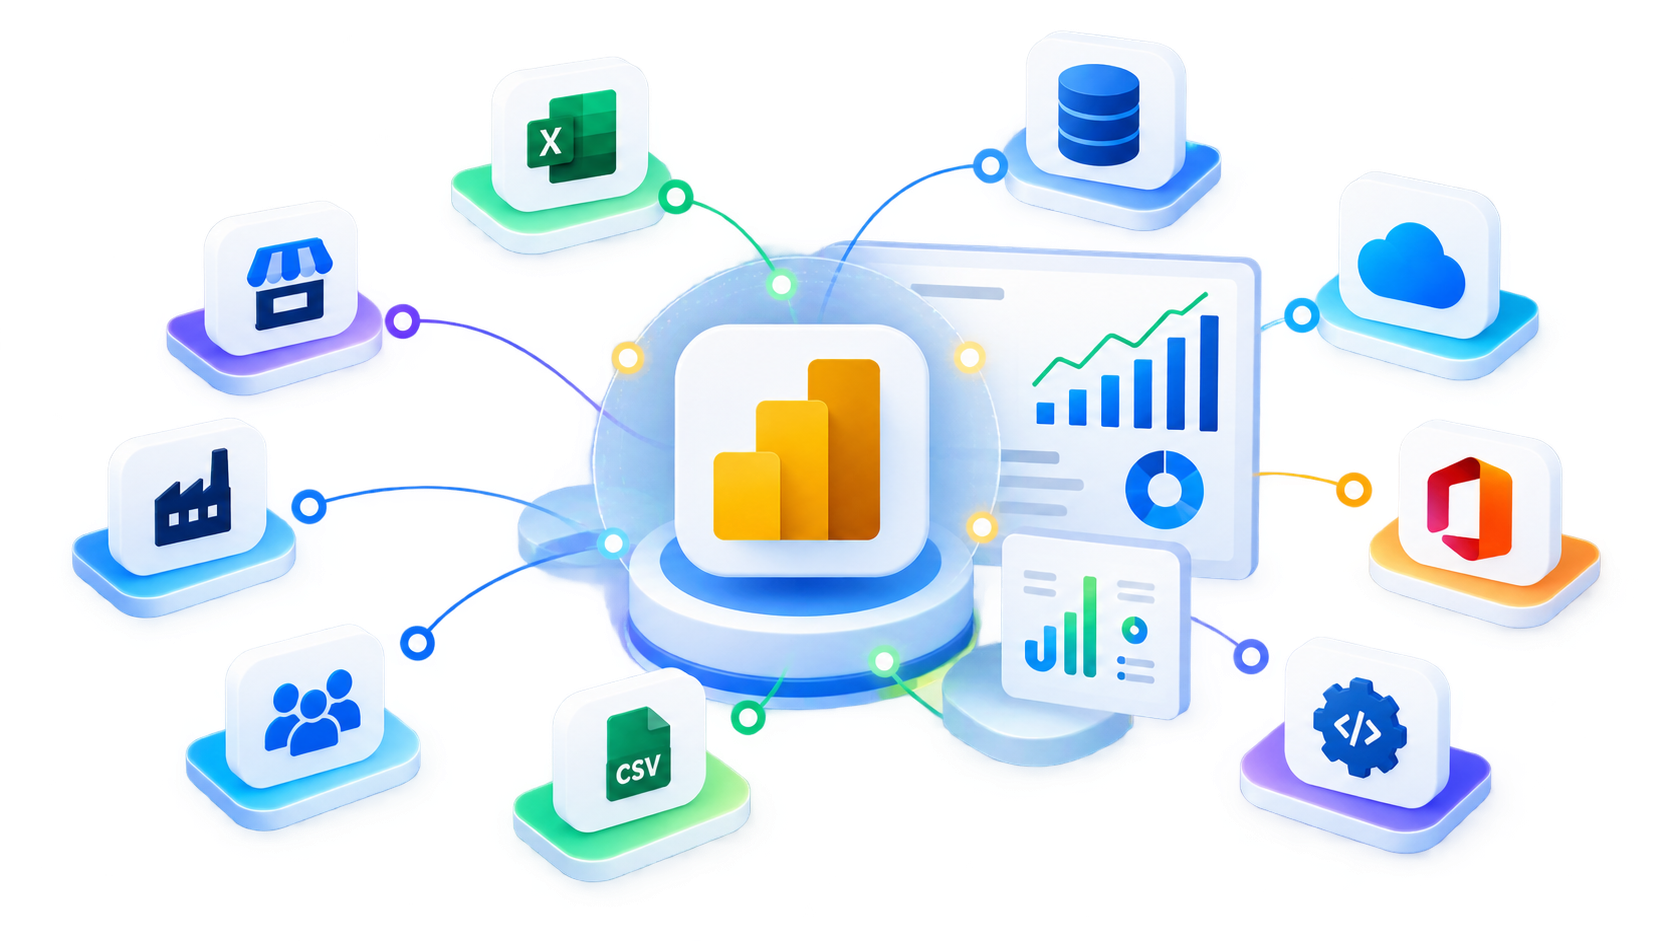
Connect reporting data from Reno ERP and other ERP platforms.
Connect supported SQL, MySQL and other database environments.
Transform spreadsheet and structured-file data into reusable reporting models.
Bring customer, sales, transaction and point-of-sale information into Power BI.
Connect information from APIs, cloud platforms and business applications where appropriate.
Works alongside Microsoft Teams, SharePoint, Power Apps, Power Automate, Microsoft 365 and Microsoft Fabric where applicable.
* Exact integration depends on source systems, Microsoft environment, licensing and technical requirements.
From executive KPI reporting to department-level dashboards, Power BI can be tailored to how each function in your business tracks performance.
Understand sales performance, revenue trends and customer demand across products, branches and sales channels through a connected business view.
Bring financial and operational data together to understand business performance, profitability, spending and financial trends.
Gain visibility into stock movement, inventory availability and supply chain operations across products, warehouses, branches and suppliers.
Understand customer behavior, purchasing patterns and relationships to identify opportunities for acquisition, engagement and retention.
Gain insights into workforce activity across departments and locations to better understand people, attendance, costs and organizational performance.
Connect production, material and inventory data to understand manufacturing operations, production efficiency and process performance.
Monitor the movement of orders, goods and deliveries to understand logistics operations, service performance and operational efficiency.
Understand online sales, customer activity, product demand and inventory through a unified view of your e-commerce operations.
Gain visibility into customer service operations, support activity and resolution performance to improve service delivery and customer experience.
Understand purchasing activities, supplier relationships and procurement performance to improve purchasing decisions and cost control.
Bring project and operational data together to track progress, resource utilization and overall execution across teams and business units.
Bring key business information together in one consolidated view, giving management a clear picture of overall business performance.
Industry Solutions
Reno Informatics delivers industry-focused Power BI solutions that transform business data into actionable insights — tailored to the unique reporting needs, KPIs and workflows of each industry.
Bring sales, inventory, billing and finance together for branch-level and company-wide reporting.
Connect production planning, bill of materials, inventory and quality information.
Bring warehouse, supplier, order and delivery information together.
Analyze online sales, orders, customer behavior, product performance and inventory.
Build financial reporting around revenue, costs, profitability, budgets and management KPIs.
Create workforce dashboards covering headcount, attendance, costs and department performance.
Bring outlet-level sales and operational information into a common reporting environment.
Support reporting around inventory, product movement, branch performance and batch/expiry where available.
Support operational and management reporting using available healthcare data.
Reno Informatics approaches Power BI as both a business reporting solution and a technical data environment.
From consulting and data modeling to dashboard development, deployment, optimization and support across the Power BI lifecycle.
Experience with ERP data provides an advantage when building analytics around sales, finance, inventory, customers and operations.
Power BI services are not limited to Reno ERP — we integrate available business data from other ERP platforms too.
Combine ERP, SQL, Excel, CRM, POS, API, cloud and other supported data sources.
Designed around business KPIs, user roles and decisions — not simply displaying available data.
Data modeling, Power Query, DAX, relationships, performance and security are built into the solution from the start.
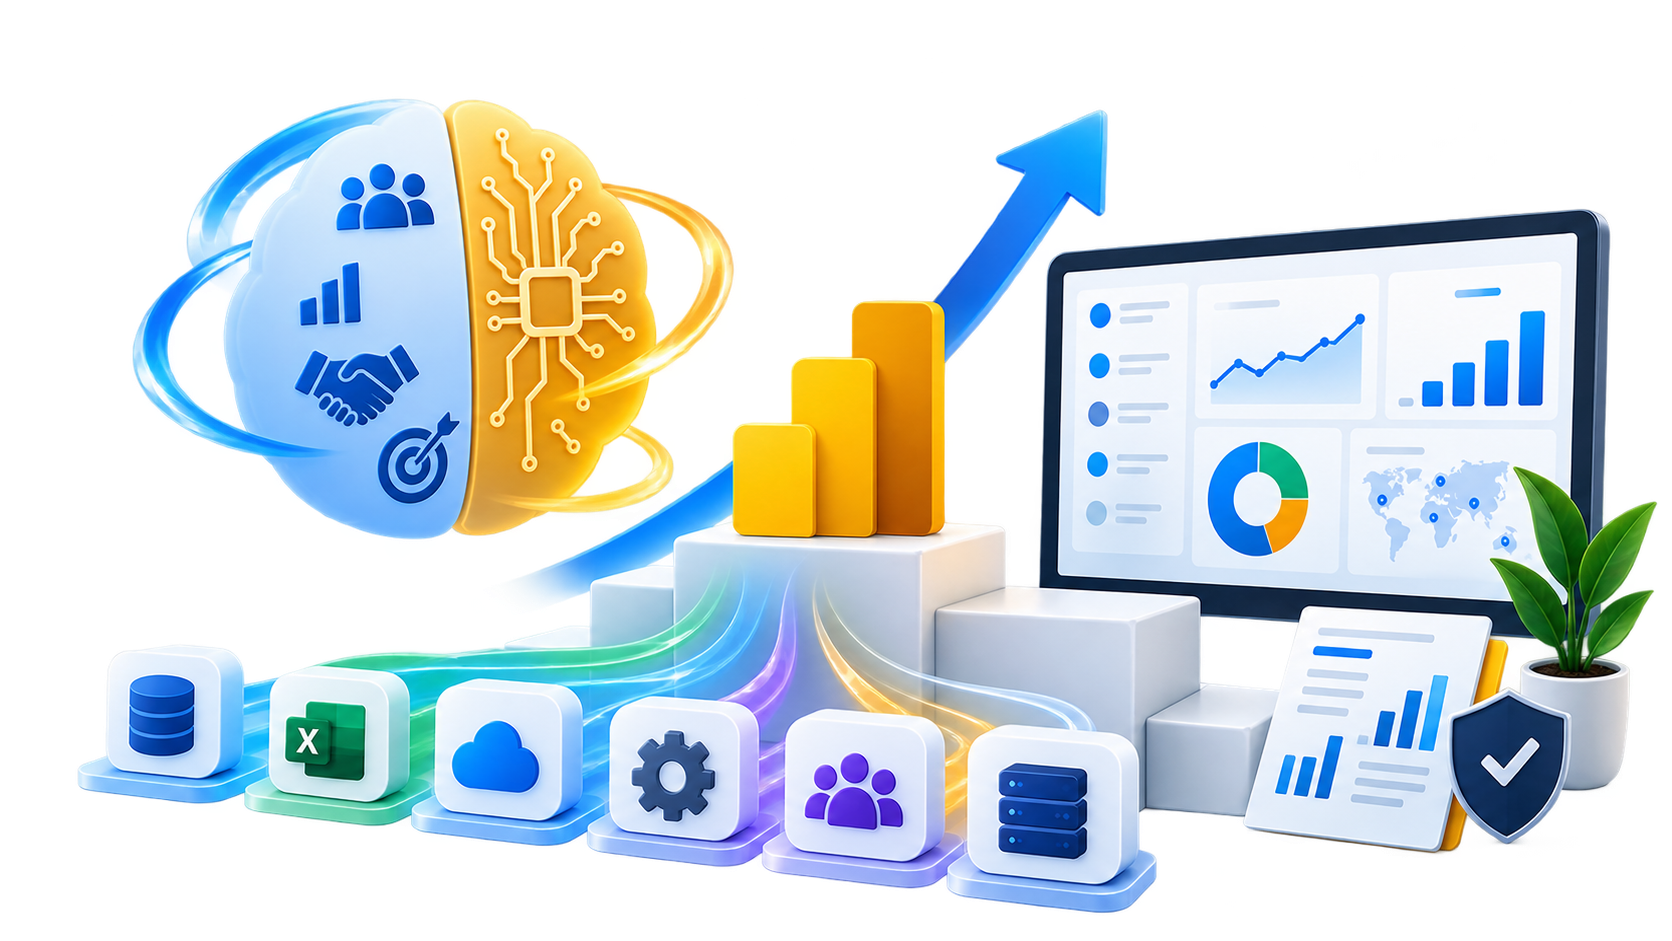
Reno Informatics uses the D.R.I.V.E. framework to structure the Power BI implementation journey around business requirements, data quality, dashboard development, validation and continuous improvement.
We understand how your business operates today—processes, existing systems, current reporting methods, users and roles, KPIs, reporting challenges, and future requirements—before development begins.
We organize and prepare reporting data: cleaning, source assessment, fact and dimension design, relationships, star-schema modeling, transformation, and resolving inconsistencies between systems.
We turn prepared data into practical reporting—dashboards, reports, KPIs, DAX measures, interactive filters, drill-downs, and business-specific views designed around users and decisions.
Before deployment we test data accuracy, KPI calculations, relationships, filters, report behavior, performance, security, user access, and refresh configuration.
After deployment the environment can grow with new KPIs, additional dashboards, branches, data sources, report improvements, performance optimization, training, and ongoing support.
Secure and Governed Power BI Reporting
Role-based access, dependable support and practical training — so every team works from governed, trustworthy reporting.
Security configuration depends on the customer's Power BI architecture, identity environment, data sources and business requirements.
Power BI support can continue after the initial implementation:
Training can be provided for report users, business teams, developers, Power BI administrators and management teams.
The objective is to help teams understand and confidently use the Power BI environment delivered for their organization.
Showcase of approved customer proof, project outcomes and Power BI experience delivered by Reno Informatics.
Trusted by retail, manufacturing, distribution and multi-branch businesses
"Reno Informatics connected our ERP, POS and inventory data into Power BI. Branch managers now see live sales and stock KPIs instead of waiting for weekend Excel packs."
Priya Menon
Operations Head · Multi-Branch Retail · Retail
"Their data model and DAX work gave us one definition of margin and fill-rate across plants. Reporting prep dropped from days to minutes with scheduled refresh."
Arun Krishnan
CFO · Mid-size Manufacturer · Manufacturing
Sample Case Study — Distribution & Wholesale
A regional distributor was exporting sales, warehouse and finance data into separate Excel files every week. Reno Informatics implemented Power BI with ERP and SQL integration, a star-schema model, role-based access for branch heads, and executive KPI dashboards with scheduled refresh.
Reporting cycle
3 days → 45 min
Dashboards live
8 interactive reports
Users onboarded
42 role-based seats
Project Result
85% faster reporting
Avg. prep time reduction
Power BI Projects
40+ Projects
Delivered implementations
Experience
10+ Years
ERP & analytics experience